Published 2026-07-04 · Data updated 2026-07-05
The FAA has logged 347,575 wildlife strikes on civil aircraft since 1990. Group the strikes identified to an animal family and a counterintuitive split appears: the families aircraft hit most are almost never the ones that damage the aircraft.
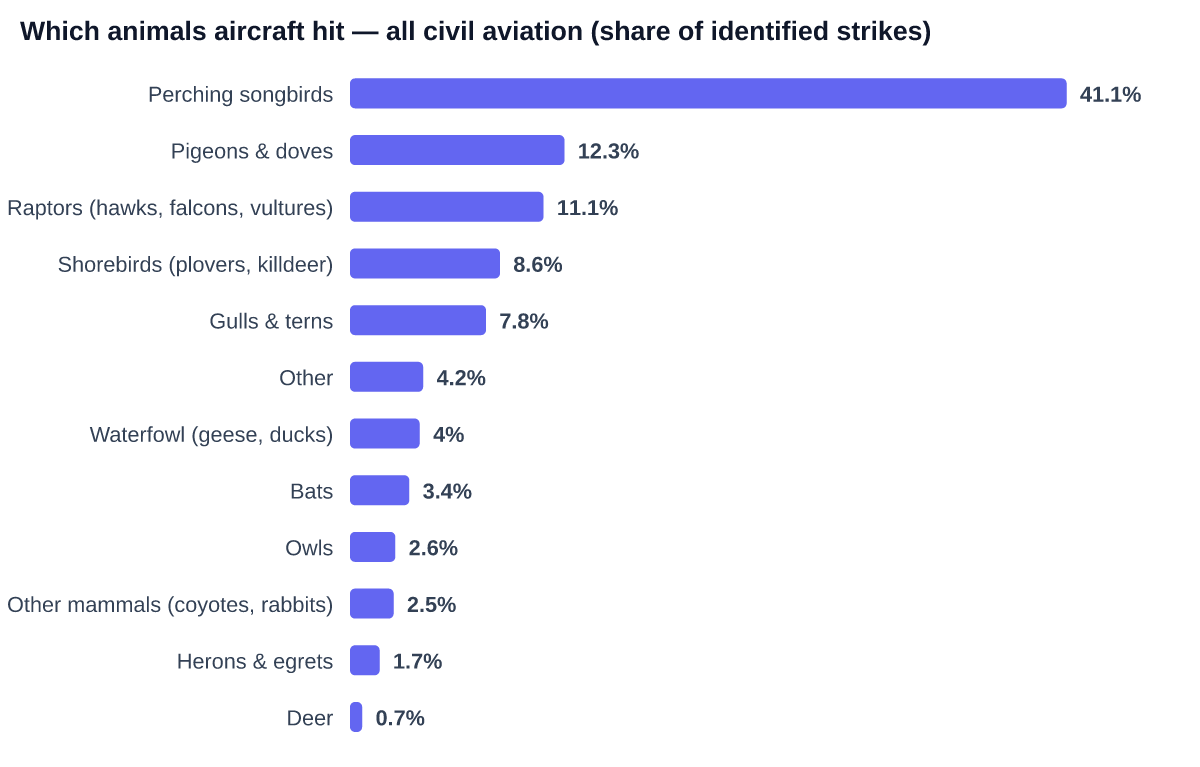
Perching songbirds — swallows, larks, starlings — are the single biggest slice at 41.1% of identified strikes, yet they damage the aircraft just 1.5% of the time: a small, light bird is mostly absorbed by the airframe. The damage comes from the heavy families that are struck far less often. The single most dangerous thing to hit is not a bird at all — white-tailed deer damage the aircraft 81.8% of the time, a runway collision with 60 kg of mammal. Among birds, waterfowl lead: geese and ducks are only 4% of strikes but damage the aircraft 36.2% of the time.
| Animal family | Share of strikes | Damage rate |
|---|---|---|
| Deer | 0.7% | 81.8% |
| Waterfowl (geese, ducks) | 4% | 36.2% |
| Raptors (hawks, falcons, vultures) | 11.1% | 11.9% |
| Gulls & terns | 7.8% | 11.1% |
| Herons & egrets | 1.7% | 9.7% |
| Other | 4.2% | 8.8% |
| Owls | 2.6% | 4.2% |
| Pigeons & doves | 12.3% | 2.9% |
| Other mammals (coyotes, rabbits) | 2.5% | 2.6% |
| Shorebirds (plovers, killdeer) | 8.6% | 1.7% |
| Perching songbirds | 41.1% | 1.5% |
| Bats | 3.4% | 0.7% |
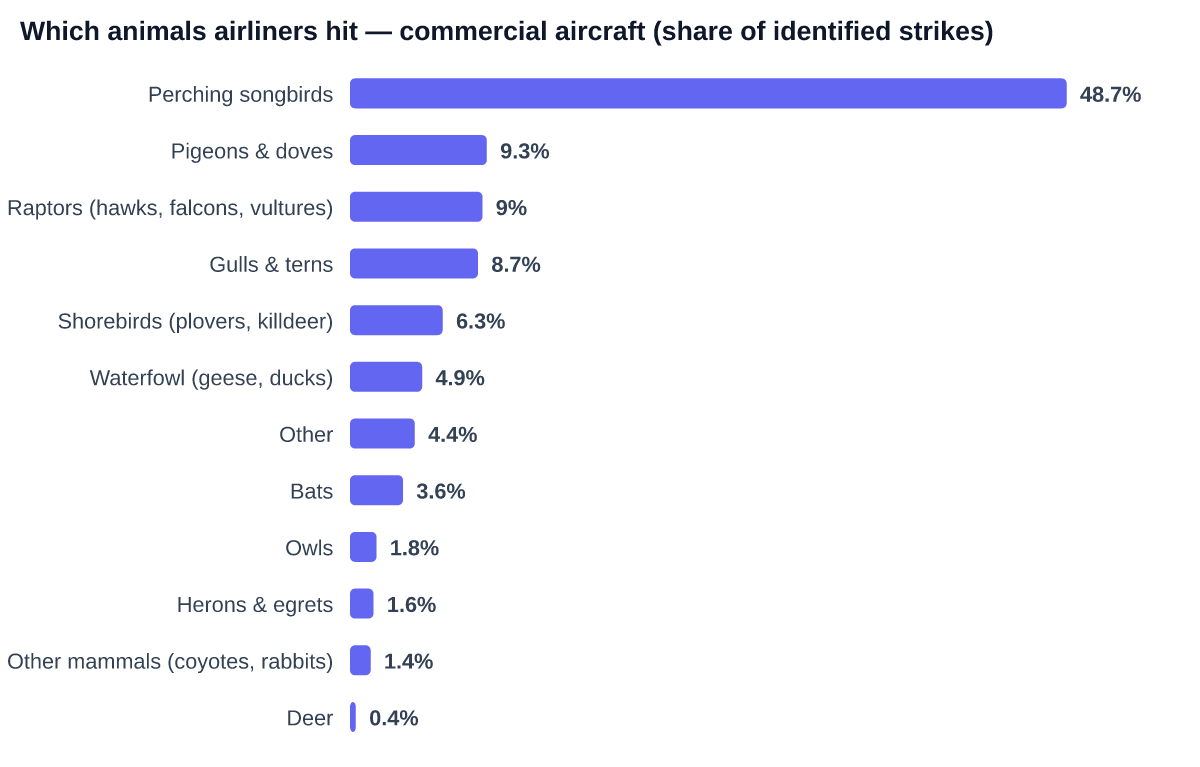
Narrow it to commercial aircraft — regional jets, airliners and heavies — and the mix shifts. Deer all but vanish: they are just 0.4% of airliner strikes, because jets fly from big, well-fenced airports where a deer on the runway is rare. Birds fill the gap, and the heaviest ones get worse: geese and ducks damage a commercial aircraft 41% of the time — the deer of the airline world.
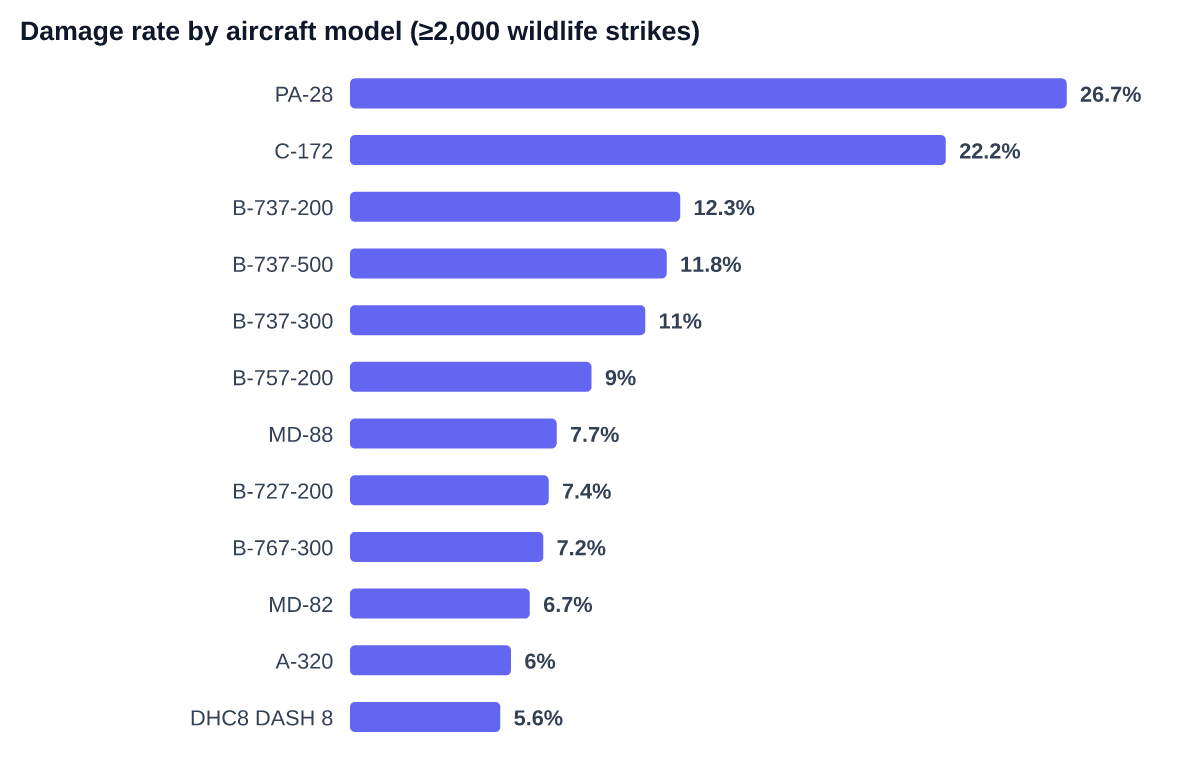
Damage risk rides on the airframe itself, too. Light general-aviation singles — the Piper PA-28, the Cessna 172 — are damaged in more than a fifth of their strikes: a small airframe has little margin, the same reason a deer on the runway is so dangerous. Among the jets, the older, smaller narrowbodies — the 737-200, -300 and -500 — report damage two to three times as often as current-generation types like the A320 flying the same routes into the same airports.
The practical reading: raw strike counts — the number airports usually publish — measure exposure, not risk. A goose on the approach path is a different problem from a swallow, a deer fence can be worth more than either, and the aircraft on the far end matters too. Wildlife-hazard programs work from damage risk; public reporting mostly counts strikes.
Methodology
Source: FAA National Wildlife Strike Database (public domain), all 347,575 reported strikes on civil aircraft, 1990–present, as normalized in the FlightFinder safety corpus. Strikes are grouped into animal families by the FAA species code (a hierarchical code whose prefix identifies the family); shares are computed over the ~210,000 strikes identified to a family, excluding records logged only as 'unidentified bird'. "Commercial" is aircraft mass class 3–5 (regional jets, airliners, heavies); the per-model chart uses the reported aircraft type. "Damaging" follows the FAA damage classification (minor through destroyed). Reporting is voluntary below Part 139 thresholds, so counts undercount reality; damage rates are less affected because damaging strikes are far more likely to be reported. Numbers on this page are recomputed nightly from the live database.
Cite this
FlightFinder analysis of FAA National Wildlife Strike Database, 2026. Underlying data: FlightFinder Data API.
Sources: FAA National Wildlife Strike Database (public domain) · FlightFinder wildlife-strikes vertical: /safety/wildlife-strikes
Query this data yourself — Data API from $49/mo · Litigation research dossiers