Bird strikes and the light aircraft
What a third of a million FAA strike reports say to general aviation pilots — and where the standard advice holds up
The bird strike that everyone remembers ended in the Hudson River with an Airbus and no fatalities. The ones that kill people happen in much smaller aeroplanes, and almost nobody writes about them. Of the 52 deaths recorded in the FAA's National Wildlife Strike Database since 1990, 50 were aboard light aircraft — piston singles and twins, light turboprops and jets, helicopters — across 23 separate accidents. 18 of those accidents happened en route, not in the circuit, and 8 involved a strike on the windscreen.
That is the first thing the data says that the safety leaflets do not: for the aeroplanes most of this audience flies, a bird strike is a structurally different event than it is for a larger one. A strike damages a light aircraft 23.7% of the time. For aircraft above 5.7 tonnes the figure is 6.6%. Broadly overlapping hazards, very different outcomes — about three and a half times the damage rate.
Where the bird hits — light aircraft against larger ones
| Part struck | Light-aircraft strikes | Damaged (light) | Larger-aircraft strikes | Damaged (larger) |
|---|---|---|---|---|
| Wing or rotor | 8,778 | 36.1% | 35,099 | 9.7% |
| Tail | 1,287 | 34.6% | 2,266 | 26% |
| Radome | 678 | 30.2% | 30,268 | 6.6% |
| Engine 2 | 867 | 25.4% | 13,132 | 18.9% |
| Landing gear | 2,637 | 23% | 12,013 | 5.3% |
| Engine 1 | 1,760 | 22.5% | 14,432 | 19.1% |
| Nose | 3,490 | 18.6% | 37,196 | 3.1% |
| Windshield | 6,165 | 16.5% | 35,160 | 1.4% |
| Fuselage | 2,736 | 14.5% | 27,840 | 2.7% |
| Propeller | 4,065 | 11.9% | 1,281 | 11.7% |
Look down the windscreen row. When a bird hits the windscreen of a light aircraft it damages it 16.5% of the time; on a larger aircraft, 1.4%. This is not a difference in luck. Transport-category windscreens are certified against penetration by a four-pound bird at the design cruising speed at sea level (14 CFR 25.775(b)), and transport-category helicopters carry a 2.2-pound version of the same requirement (29.631). Nothing of the kind applies to a Cessna 172. Its windscreen is there to keep the weather out.
The same asymmetry runs through the whole table. The light-aircraft column is worse in every single row, and on the surfaces that meet the bird head-on — windscreen, nose, radome — it is worse by a factor of roughly five to twelve. Only the propeller, the engines and the tail come close to parity, and that is small comfort: an engine is a worse thing to lose in a single than in a twinjet. A light airframe has less mass to absorb the same impact energy, less redundancy behind each surface, and no engineering margin bought specifically for this.
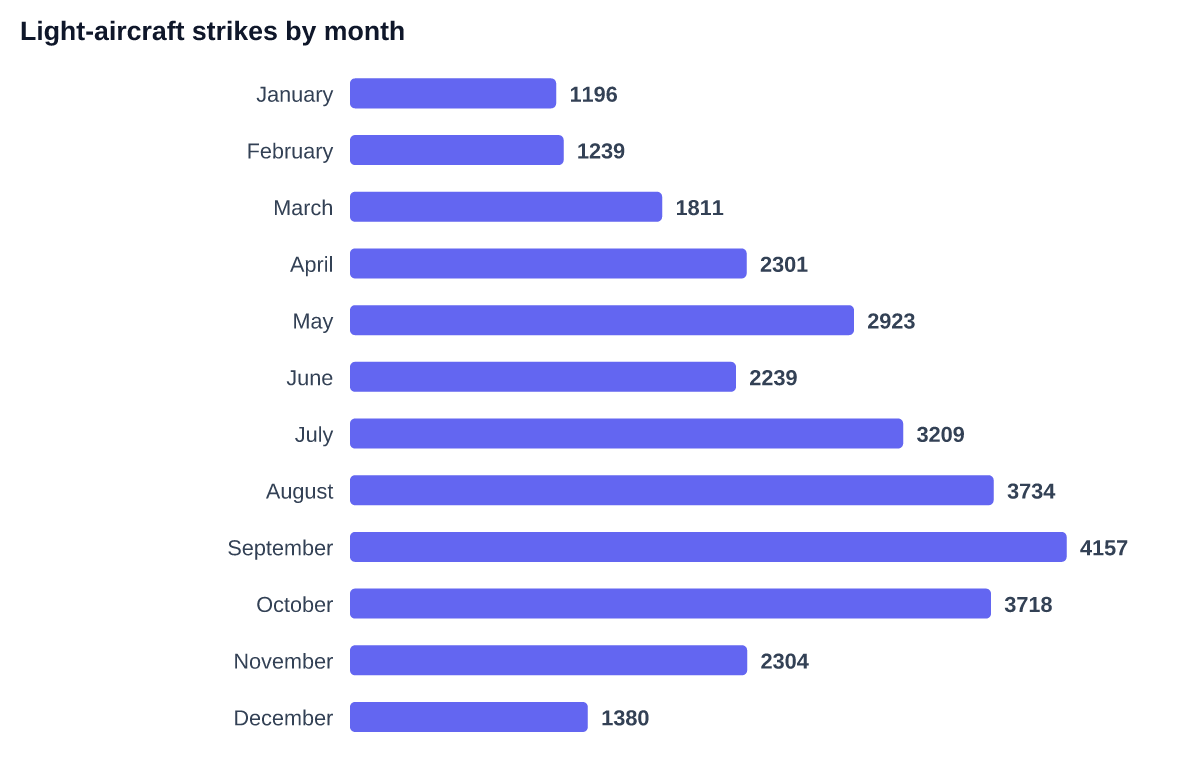
Light-aircraft strikes by month
| Month | Strikes | Damage rate |
|---|---|---|
| January | 1,195 | 32% |
| February | 1,239 | 33.6% |
| March | 1,811 | 36.7% |
| April | 2,304 | 27.9% |
| May | 2,938 | 20% |
| June | 2,367 | 19.4% |
| July | 3,270 | 16.1% |
| August | 3,734 | 17.4% |
| September | 4,157 | 19.4% |
| October | 3,718 | 23.4% |
| November | 2,304 | 33% |
| December | 1,381 | 32.9% |
The season is the part most commonly imported wholesale from European guidance, and it transfers only in part. The EGAST leaflet does name the autumn migration — September and October — so the American peak is not a month European guidance overlooks. What travels badly is the emphasis around it. The leaflet's sharpest warnings fall on March, which it calls the peak of migration intensity, and on June and July, when inexperienced juveniles are learning to fly. Neither is where the American light-aircraft record is heaviest: the peak is September, with August and October close behind, driven by an autumn migration that runs down flyways the length of a continent and takes months to pass. March sits near the quiet end of the American year.
So a European leaflet read in the United States gets the autumn right and the emphasis wrong. The months it marks hardest are not the months this record is heaviest, which is worth knowing before a calendar written for one continent is used to plan caution on another.
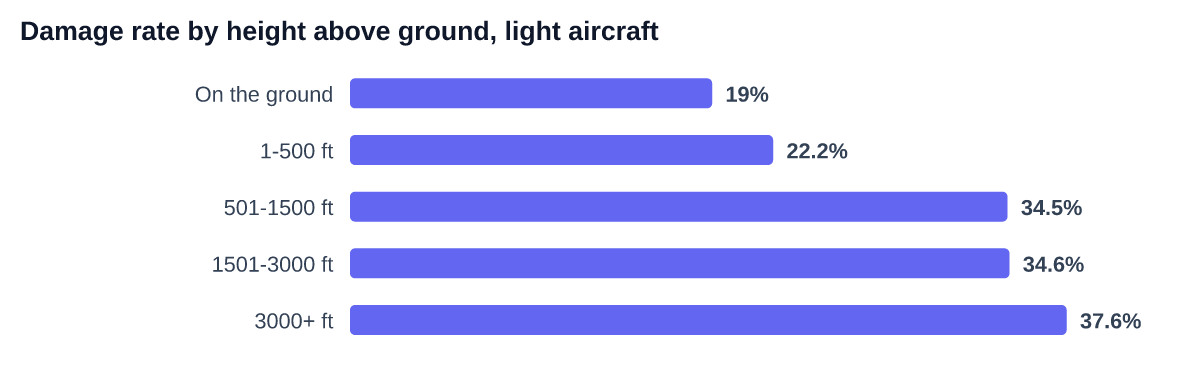
Damage rate by height above ground, light aircraft
| Band | Strikes | Damage rate |
|---|---|---|
| On the ground | 8,446 | 19% |
| 1-500 ft | 7,405 | 22.1% |
| 501-1500 ft | 4,939 | 34.4% |
| 1501-3000 ft | 2,559 | 34.5% |
| 3000+ ft | 1,100 | 37.5% |
Here the data complicates the standard advice rather than confirming it. The leaflet's "plan to fly as high as possible; most birds fly at only a few thousand feet AGL" is true about how often a strike happens: over half of all light-aircraft strikes happen on the ground roll or below 500 feet, and just under two-thirds of those where a height was recorded at all. But the damage rate moves the other way. A strike on the ground damages the aircraft 19% of the time. Above 3,000 feet it is 37.5% — twice as bad.
The honest reading is not that altitude causes damage. It is that altitude selects for the worst encounters: the birds that cruise at 3,000 feet are geese, vultures and raptors, not sparrows, and they are met at cruise speed rather than at rotation. Climbing reduces exposure. It also raises the stakes of the exposure that remains.
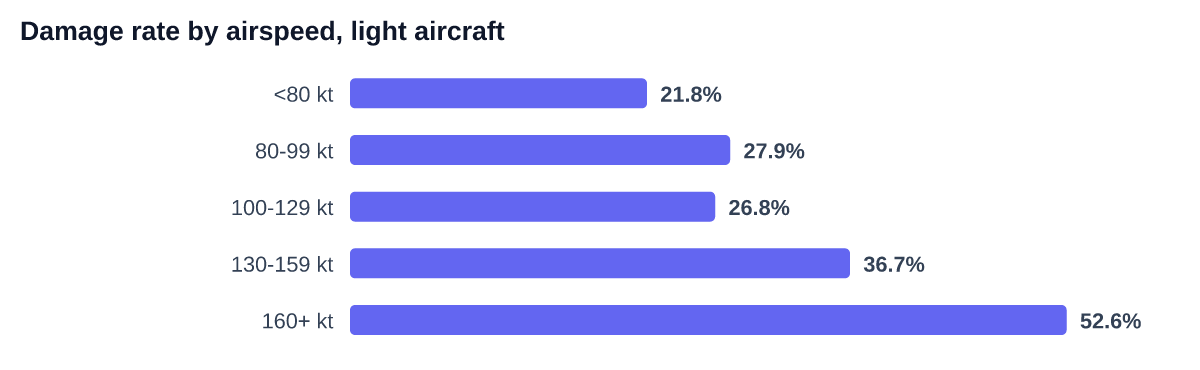
Damage rate by airspeed, light aircraft
| Band | Strikes | Damage rate |
|---|---|---|
| <80 kt | 4,808 | 21.8% |
| 80-99 kt | 3,542 | 27.8% |
| 100-129 kt | 6,144 | 26.8% |
| 130-159 kt | 1,825 | 36.6% |
| 160+ kt | 1,058 | 52.6% |
Speed is where the standard advice holds up completely. Impact energy goes with the square of the closing speed, and the data follows: below 80 knots a strike damages the aircraft 21.8% of the time, and above 160 knots it is 52.6% — better than even odds. Speed is the variable the damage rate answers to most cleanly, which is what makes it the one figure in this record worth quoting on its own.
Darkness looks dangerous at first glance: strikes at night damage the aircraft 27.9% of the time against 21.9% by day. But most of that gap is not birds. It is deer — nocturnal, heavy, and standing on the runway; 888 of the night strikes involve a mammal rather than a bird. Count birds alone and most of the gap goes: 23% after dark against 21% by day. What is left is small but real, and dusk is worse than either. Birds do fly at night, and the strike record says so — but the animal most likely to ruin a night landing has four legs.
And the warning rarely comes. Only 17.6% of the 30,418 light-aircraft reports record a prior warning of bird activity — though the field is often left blank, and among the reports that answered the question at all it is 30.3%. Either way, most of these pilots were surprised. The tools are thinner here than the folklore suggests on either side: US sectionals do chart wildlife refuges, and AIM 7-5-6 asks for 2,000 feet above them, but nothing charts the seasons or the species the way German aeronautical charts do, and the radar-driven forecasts that do exist are aimed elsewhere: the Air Force's Avian Hazard Advisory System, public but organised around military routes, ranges and airfields, and BirdCast's nightly migration maps, built for ornithology rather than flight planning.
What hits light aircraft, and how often it does damage
| Species | Strikes | Damage rate |
|---|---|---|
| White-tailed deer | 1,003 | 87.9% |
| New World vultures | 213 | 74.6% |
| Turkey vulture | 508 | 68.5% |
| Canada goose | 703 | 57.6% |
| Ducks | 309 | 52.4% |
| Red-tailed hawk | 416 | 42.1% |
| Hawks | 450 | 36.9% |
| Gulls | 1,602 | 27% |
| Rock pigeon | 518 | 17.6% |
| Blackbirds | 212 | 15.6% |
| Doves | 229 | 10% |
| Killdeer | 341 | 7.6% |
| European starling | 382 | 6.8% |
| Mourning dove | 709 | 6.6% |
| American kestrel | 433 | 3.5% |
| Sparrows | 473 | 3% |
| Horned lark | 242 | 2.5% |
| Barn swallow | 304 | 1.6% |
The animal that most reliably wrecks a light aircraft is not a bird. White-tailed deer were struck 1,003 times and did damage in 87.9% of them — the worst record of anything in the database, and a reminder that the runway at a quiet field is a food source at dusk. Behind the deer come the vultures, the Canada goose and the ducks, all above fifty per cent, then the hawks. At the bottom of the table sit the sparrows, kestrels and starlings — struck constantly, almost never a problem.
This is why "how many birds" is the wrong question and "which birds" is the right one. A flock of starlings across the numbers is a wash and a logbook entry. One Canada goose is an airframe.
What it actually costs
Most bird strikes are not accidents, and the database records what happened next. Light-aircraft strikes produced 5,253 precautionary landings, 1,335 rejected take-offs, 348 injuries, 929,559 aircraft-hours out of service — about 38,732 aircraft-days — and $143.3M in repairs, adjusted for inflation. Up to 22.3% of these strikes changed the flight.
What the numbers point to
None of this is a checklist, and the database is in no position to write one — it records what happened, not what anyone should do about it. But a few things in it are consistent enough to be worth carrying:
- Speed carries the most weight. It is the one piece of standard advice these numbers back without qualification: the damage rate more than doubles between the slowest and the fastest band.
- Height buys fewer encounters, not gentler ones. Climbing changes how often, not how badly.
- Darkness does not behave the way "birds are asleep" suggests — and in this record the reason is mostly four-legged rather than feathered.
- The deer are the outlier. Nothing else in the database damages an aircraft as consistently, and they turn up at unlit fields after dark.
- Damage hides. What ends up grounding an aircraft is routinely found behind a cowling or in the tail, on the ground rather than in the air — which is one reason the thousands of precautionary landings above are hard to read as over-caution.
- The counts are a floor. US reporting is voluntary, so every total here is the strikes somebody chose to file, not the strikes that happened. Reports go to the FAA at wildlife.faa.gov.
Per-airport, per-species and per-aircraft breakdowns of the whole database live in our wildlife strike tracker.
Methodology
Source: the FAA National Wildlife Strike Database (US Government public domain), 354,556 reports. "Light aircraft" is the FAA's AC_MASS classes 1–2 — airframes up to 5,700 kg, which covers piston singles and twins, light turboprops and most helicopters; "larger aircraft" is AC_MASS 3–5, which starts at 5,700 kg and so takes in business jets and turboprop twins as well as airliners. A strike counts as damaging when DAMAGE_LEVEL is Minor, Uncertain, Substantial or Destroyed. Per-part rates are conditional: of the strikes that hit that part, the share that damaged it.
Coverage: the database runs from 1990 to the present, and 2026 is a partial year. Aircraft mass is unrecorded on about 28% of all reports; those rows fall into neither segment, and they carry almost no damaging strikes, so both segments are drawn from the better-documented part of the record. Within the light-aircraft segment the pooled figures mix a Cessna 152 with a 5,700 kg turboprop twin: the pooled rate hides that spread, and this dataset ships no class-1-only cut with which to show it.
Two cautions. US strike reporting is voluntary, and general-aviation reporting in particular is known to be incomplete, so every absolute count here is a floor rather than a census; rates within the dataset are far more trustworthy than totals. The height gradient is confounded — strikes higher up involve heavier aircraft and larger birds, so the rise is real but is not evidence that climbing causes damage on its own. So is the speed gradient, in the same way and for the same reason. Speed has the stronger prior — impact energy goes with the square of closing speed — but this dataset cannot separate speed from aircraft type, and nothing here claims it does. Figures refresh with the underlying dataset. Every statistic quoted in the prose, and every chart, is computed from it at render time and carries a sanity check: if a figure moves outside the range the sentence around it claims, the passage containing it is withheld rather than published, and so is a chart whose check fails. The numbers written by hand are the bucket boundaries (80 and 160 knots, 500 and 3,000 feet), the rounded total in the subtitle, and the two coverage shares — the unrecorded-mass figure above and the missing-airspeed figure in the airspeed caption.
Cite this
FlightFinder analysis of the FAA National Wildlife Strike Database, 2026. Underlying data: FlightFinder Data API.
Sources: FAA National Wildlife Strike Database (US Government public domain): https://wildlife.faa.gov/ · EGAST (European General Aviation Safety Team) leaflet GA6, 'Bird strike, a European risk with local specificities', Edition 1 – Germany, 2013 — a translation of AOPA-Germany's Safety Letter 'Vogelschlag', June 2012 · FlightFinder wildlife strike tracker: /wildlife-strikes
Query this data yourself — Data API from $49/mo · Litigation research dossiers