Europe's bird-strike advice, measured against America's bird-strike data
A third of a million American records against two thousand British ones a year — and the seasons, the species and the reporting duties all differ.
Two aviation authorities collect bird strikes, and they have built almost opposite instruments.
The United States runs the world's largest strike database: 354,556 reports, each carrying the species, the phase of flight, the height, the speed, the part struck and the repair bill. What the records themselves do not carry is a denominator. Reporting is voluntary, so nobody knows how many strikes went unreported, and no field in the database says how many aircraft moved. The FAA closes that gap once a year in a separate report, joining the strike counts to national movement data to publish strikes and damaging strikes per 100,000 movements — which is how we know the damaging-strike rate at general aviation airports has been rising while the rate at large certificated airports held steady. But that number lives in an annual PDF, not in the data, and it is published by airport category and year only.
The United Kingdom collects a fraction of the volume — 1,702 confirmed strikes in 2025 — and publishes the rate in the same breath as the count: strikes per 10,000 aircraft movements, month by month, in the same workbook. Nobody publishes a monthly rate for the United States. That is the practical difference — not that one country measures exposure and the other does not, but that the British figure is attached to the data at the resolution you would actually want to compare, and the American one is assembled once a year at the level of an airport category.
This is worth stating plainly before any comparison: the gap between the two totals is a difference in reporting duty and in the size of the aviation system, not a difference in how dangerous birds are. Everything below is read as shape — each country against its own year. The raw counts are printed for transparency; they are not comparable to each other.
When birds hit aircraft: the United Kingdom against the United States
| Month | UK reported incidents | UK share of year | US strikes (5.7 t and above) | US share of year |
|---|---|---|---|---|
| January | 53 | 2.6% | 6,892 | 3.1% |
| February | 63 | 3.1% | 6,540 | 2.9% |
| March | 151 | 7.5% | 10,852 | 4.9% |
| April | 116 | 5.7% | 17,893 | 8% |
| May | 148 | 7.3% | 25,369 | 11.3% |
| June | 225 | 11.1% | 17,637 | 7.9% |
| July | 318 | 15.7% | 24,617 | 11% |
| August | 272 | 13.4% | 28,762 | 12.9% |
| September | 286 | 14.1% | 30,611 | 13.7% |
| October | 198 | 9.8% | 30,542 | 13.7% |
| November | 120 | 5.9% | 15,850 | 7.1% |
| December | 75 | 3.7% | 8,171 | 3.7% |
The season is genuinely different, and not by a little. One caveat first: the British monthly series counts all reported incidents, not just confirmed strikes, and sightings plausibly skew toward the bright, busy months — so read the British summer peak as an upper bound on its sharpness. The British peak is July — 15.7% of the year's reported incidents in a single month, with a sharp rise through June, a dip in August and a second, smaller September shoulder before the autumn falls away. The American peak is September, and it is not a peak so much as a plateau: August, September and October each carry roughly 13–14%, a three-month season rather than a spike.
Two things drive that. British bird strikes are dominated by resident species — wood-pigeons, gulls, buzzards — whose fledglings take to the air in high summer, so the risk tracks the breeding calendar. The North American picture is dominated by migration down flyways that run the length of a continent, and a continental migration takes months to pass. Spring divides less cleanly: March is 7.5% of the British year against 4.9% of the American one, but April and May run the other way — the American series carries a May shoulder Britain does not. Both continents have a spring signal; the months simply do not line up.
The practical consequence is unglamorous but real. Bird-strike guidance written for one continent carries a calendar with it, and the calendar is usually the first thing a reader takes away — even where, as here, the two continents share an autumn and part company over the summer.
UK reported birdstrikes per 10,000 aircraft movements, by month
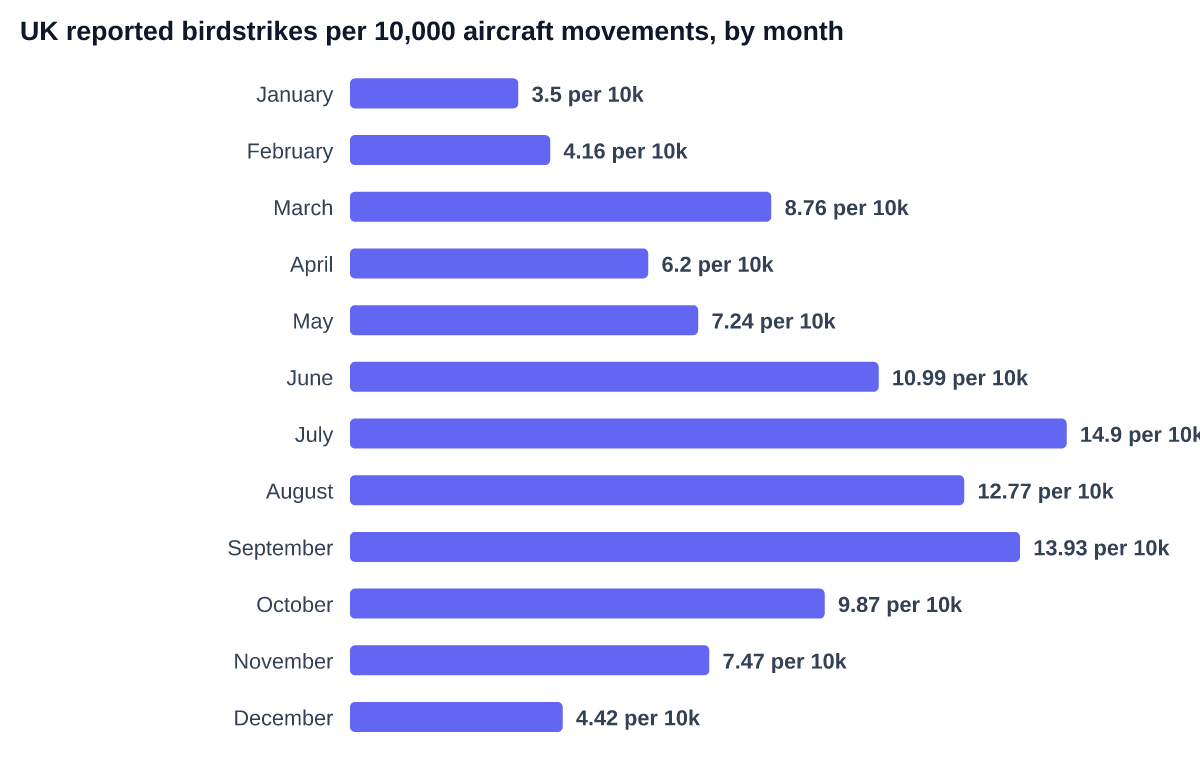
| Month | Strikes | Per 10,000 movements |
|---|---|---|
| January | 53 | 3.5 |
| February | 63 | 4.16 |
| March | 151 | 8.76 |
| April | 116 | 6.2 |
| May | 148 | 7.24 |
| June | 225 | 10.99 |
| July | 318 | 14.9 |
| August | 272 | 12.77 |
| September | 286 | 13.93 |
| October | 198 | 9.87 |
| November | 120 | 7.47 |
| December | 75 | 4.42 |
UK reported birdstrikes by year and status
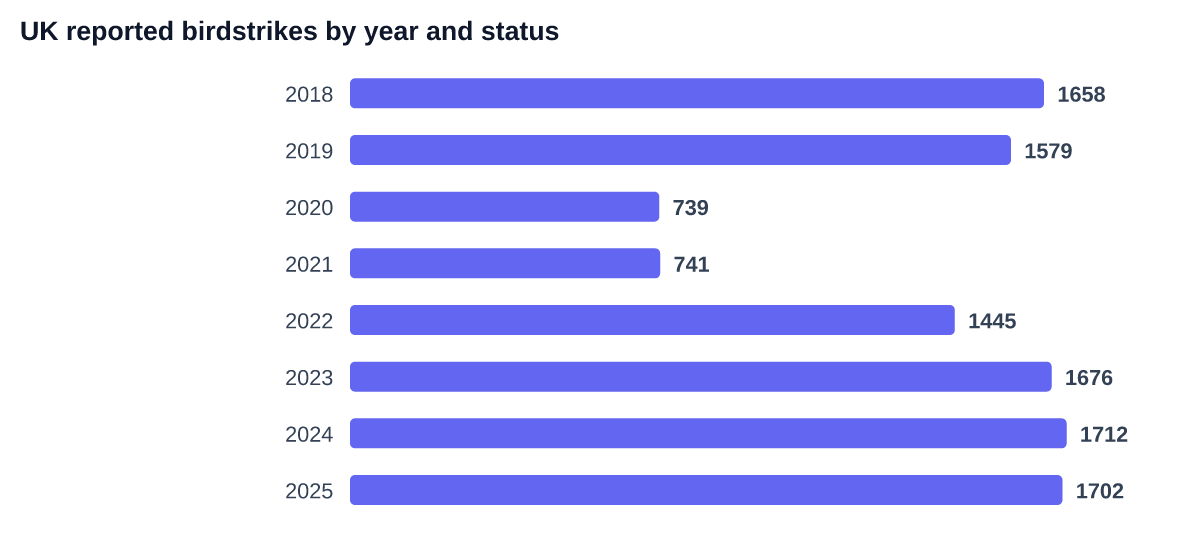
| Year | Confirmed | All reports |
|---|---|---|
| 2018 | 1,658 | 2,107 |
| 2019 | 1,579 | 2,205 |
| 2020 | 739 | 806 |
| 2021 | 741 | 833 |
| 2022 | 1,445 | 1,538 |
| 2023 | 1,676 | 1,767 |
| 2024 | 1,712 | 1,861 |
| 2025 | 1,702 | 2,025 |
Put the rate next to those counts and the value of a denominator becomes obvious. The British count collapses in 2020 and 2021 and recovers afterwards. Nobody would read that as two unusually safe years for birds — traffic had stopped. A count measures the aviation system; a rate measures the hazard.
That is worth holding on to when reading any raw strike count, including the ones elsewhere on this site. A year-over-year rise in American strike reports is not by itself evidence that flying got more dangerous: traffic grew, reporting culture improved, and wildlife-management programmes at large airports got better, all at once. The FAA's own annual analysis separates those threads where it can, and it is the reason its headline finding is a rate and not a count. The limitation is not that the exposure data is missing — it is that it is not attached to the records, so every analysis built directly on the database, this one included, is working with counts and shares rather than risk.
The advice, tested
European general-aviation guidance — the EGAST leaflet is the most widely circulated reference, though it is a 2013 translation of a German document and says so on its cover — makes a set of concrete recommendations. Set against the American data, they divide cleanly into three groups.
Supported by the data. The speed guidance is the strongest of them — the leaflet puts it as "reducing the airspeed by about 30% results in a half of the impact energy" — and in the US light-aircraft records the damage rate runs from 21.8% below 80 knots to 52.6% above 160. "After a bird strike land as soon as possible and determine the extent of the damage" is supported by consequence rather than rate — thousands of precautionary landings sit in the record, and the damage that grounds an aircraft is routinely found only after shutdown. "Keep in mind that birds also fly at night" only half survives. American night strikes do damage light aircraft more often than daytime ones — but separate out the deer, which are nocturnal and destructive, and the bird-only night penalty is under two percentage points. The thing that makes darkness dangerous in the American record is mostly a mammal on the runway, which is not what the leaflet is warning about.
True, but not the whole truth. The leaflet's two separate statements — that the danger is highest near an airport and at lower altitudes, and that a pilot should plan to fly as high as possible — are correct about frequency and, read together, misleading about consequence. Over half of light-aircraft strikes happen on the ground roll or below 500 feet, but the damage rate roughly doubles between the ground and 3,000 feet, because altitude selects for big birds met at cruise speed. Height reduces how often, not how badly.
Transfers, but thinly. The leaflet's most practical advice is to check the BIRDTAM and the bird areas charted on the VFR chart. It is worth being precise about the American equivalents, because they exist and are widely assumed not to. US sectionals chart national wildlife refuges, and AIM 7-5-6 asks pilots to stay 2,000 feet above them — the same altitude the German leaflet asks for, though the American request is written to protect the wildlife rather than the aircraft. AIM 7-5-5 covers pilot advisories on bird and other wildlife hazards, pointing at the NOTAM system and the Chart Supplement; known bird activity also reaches pilots through the ATIS. Radar-driven forecasts exist too: the Avian Hazard Advisory System, run by the US Air Force and reachable by anyone, though organised around military routes, ranges and airfields; and BirdCast, which publishes nightly NEXRAD migration forecasts for the whole country, built for ornithology rather than flight planning. What the United States lacks is Germany's combination — bird areas charted with their seasons and their species, aimed at civil pilots. And BIRDTAM is a NATO product, not a European-wide civil facility: the leaflet describes a German arrangement, not a continental one. In the American records 17.6% of light-aircraft reports note a prior warning, 30.3% among those that answered the question at all.
The species advice does not transfer either. German returns put swallows and swifts at 30% of strikes and falcons — kestrels above all — at 13%, on a national sample in which the leaflet says more than half of strikes could not be identified to species. The American mix is nothing like it, and the birds are not even the same: the common kestrel there against the American kestrel here, which on the same identified-only basis is about 3% of light-aircraft strikes and damages the aircraft 3.5% of the time. The animal at the top of the American damage table is a white-tailed deer standing on the runway.
The full American breakdown — by airport, species, aircraft and phase of flight — is in our wildlife strike tracker, and the general-aviation analysis is in Bird strikes and the light aircraft.
Methodology
Sources: the FAA National Wildlife Strike Database (US Government public domain) and the UK Civil Aviation Authority's annual reported-birdstrike workbook for 2025, which publishes counts by year and status and monthly counts with a rate per 10,000 aircraft movements.
The United Kingdom stands in for Europe here, and the substitution is imperfect. France's DGAC publishes a comparable annual bulletin, with a rate per 10,000 movements and a monthly breakdown by animal family; the UK workbook was chosen because its month-by-month series is machine-readable and reaches back further, not because it is the only one. What does not exist is a pan-European set: occurrence data sits in the European Central Repository, the pan-European store behind ECCAIRS, which Regulation 376/2014 opens fully only to national safety authorities, EASA and the Commission, with case-by-case extracts for other parties — not a basis for a published time series. EASA's Annual Safety Review shows bird strike as one labelled bar in an accident-category chart, with no values printed. EASA's European Plan for Aviation Safety carries bird and wildlife strike as safety issue SI-0045; the EGAST leaflet — a 2013 translation of a German AOPA safety letter, published as "Edition 1 – Germany" — and the German DAVVL committee's returns are cited here for the European advisory position and for German species figures, not as a source of comparable statistics.
The FAA does publish movement-normalised strike rates — strikes and damaging strikes per 100,000 movements, by airport category and year, in its annual Wildlife Strikes to Civil Aircraft report, using national movement data the strike database itself does not carry. Those rates are not reproduced here because they are annual and categorical, and this comparison is monthly. UK reporting comes overwhelmingly from commercial traffic at CAA-reporting aerodromes, so the US comparator throughout is the larger-aircraft segment (AC_MASS 3–5, which starts at 5,700 kg) rather than the whole database. Monthly comparison is by each country's share of its own year; absolute counts are shown but never compared across countries, because a third of a million voluntary US reports and roughly 2,000 mandatory UK reports a year measure different things. The workbook's own total row sums the twelve monthly rates rather than computing an annual one, and that figure is deliberately not reproduced here.
Cite this
FlightFinder analysis of FAA and UK CAA bird-strike data, 2026. Underlying data: FlightFinder Data API.
Sources: FAA National Wildlife Strike Database (US Government public domain): https://wildlife.faa.gov/ · Dolbeer, R. A. et al., Wildlife Strikes to Civil Aircraft in the United States (FAA annual report) — source of the movement-normalised US strike rates: https://www.faa.gov/airports/airport_safety/wildlife/ · UK Civil Aviation Authority, reported birdstrikes: https://www.caa.co.uk/data-and-analysis/safety-and-security/birdstrike-data/ · EGAST (European General Aviation Safety Team) leaflet GA6, 'Bird strike, a European risk with local specificities', Edition 1 – Germany, 2013 — a translation of AOPA-Germany's Safety Letter 'Vogelschlag', June 2012 · EASA European Plan for Aviation Safety, safety issue SI-0045 (bird and wildlife strikes) · Deutscher Ausschuss zur Verhütung von Vogelschlägen im Luftverkehr (DAVVL): https://www.davvl.de/ · FlightFinder wildlife strike tracker: /wildlife-strikes
Query this data yourself — Data API from $49/mo · Litigation research dossiers